THE POWER OF VISUALISATION AND COLLABORATION CAN RESULT IN A SIGNIFICANT SHIFT IN COMPETITIVE ADVANTAGE
VALUE CHAIN COLLABORATION PART A
THE POWER OF VISUALISATION AND COLLABORATION CAN RESULT IN A SIGNIFICANT SHIFT IN COMPETITIVE ADVANTAGE
ONCE YOU ARE PART OF A TRULY CONNECTED VALUE CHAIN, BUILT ON TRUST, EVERYTHING CHANGES.
ONCE YOU ARE PART OF A TRULY CONNECTED VALUE CHAIN, BUILT ON TRUST, EVERYTHING CHANGES.
In our recent thought leadership piece, we revealed that there are already opportunities in your and your trading partners’ wider value chains that can be unlocked. We also brought in the Value Chain Maturity Model – an approach to understand and improve on the capabilities of your organisation and trading partners in order to leverage opportunities in your wider value chain.
NOW, WE WILL TAKE A MORE IN-DEPTH LOOK AT THE POWER OF COLLABORATION USING DATA-DRIVEN INSIGHTS
NOW, WE WILL TAKE A MORE IN-DEPTH LOOK AT THE POWER OF COLLABORATION USING DATA-DRIVEN INSIGHTS
To facilitate focused collaboration, it is key to achieve a common understanding of how the value chain works. This ensures a joint understanding of risks and opportunities and facilitates the identification of the required insights to drive focused collaboration between value chain partners, along with the facts and data which will be required to achieve those insights. The common goal should and must be to avoid different versions of the truth as early on in the process as possible.
As illustrated in the diagram below, value chain partners should be focused on golden data threads which can expose win-win and hidden insights and opportunities. The collaboration process should be ongoing and based on facts and data, rather than the results of one-off projects or initiatives. It is built on trust and embedded in the culture of partner organisations and value chain partners share specific data and incentives to collaborate.
Variety Options Primary Processing Waste Hotspots Procurement Data
TIER 2 SUPPLIER
Cost of Logistics Waste Hotspots Sourcing Regions Secondary Markets Procurement Data
TIER 1 SUPPLIER
Order Fill Data Recipe Configuration Production Efficiencies Product Costing Procurement Data
RETAILER / CONSUMER SERVICES
Sales Promotions Market Share Customer Complaints Store Waste Product Design
Figure 1
For example, let’s assume value chain partners agree on the need to review and redesign a current product and category offering and target pricing to an opportunity in the market and to take advantage of shifting market conditions driven by consumer needs for a more cost-effective productive offering. It is key for partners to understand the value chain and cost dynamics of the current offering in order to identify and target selected opportunity spaces and the insights and data required to deliver on it.
IN SHORT, A THREE-STEP PROCESS APPLIES IN THIS EXAMPLE
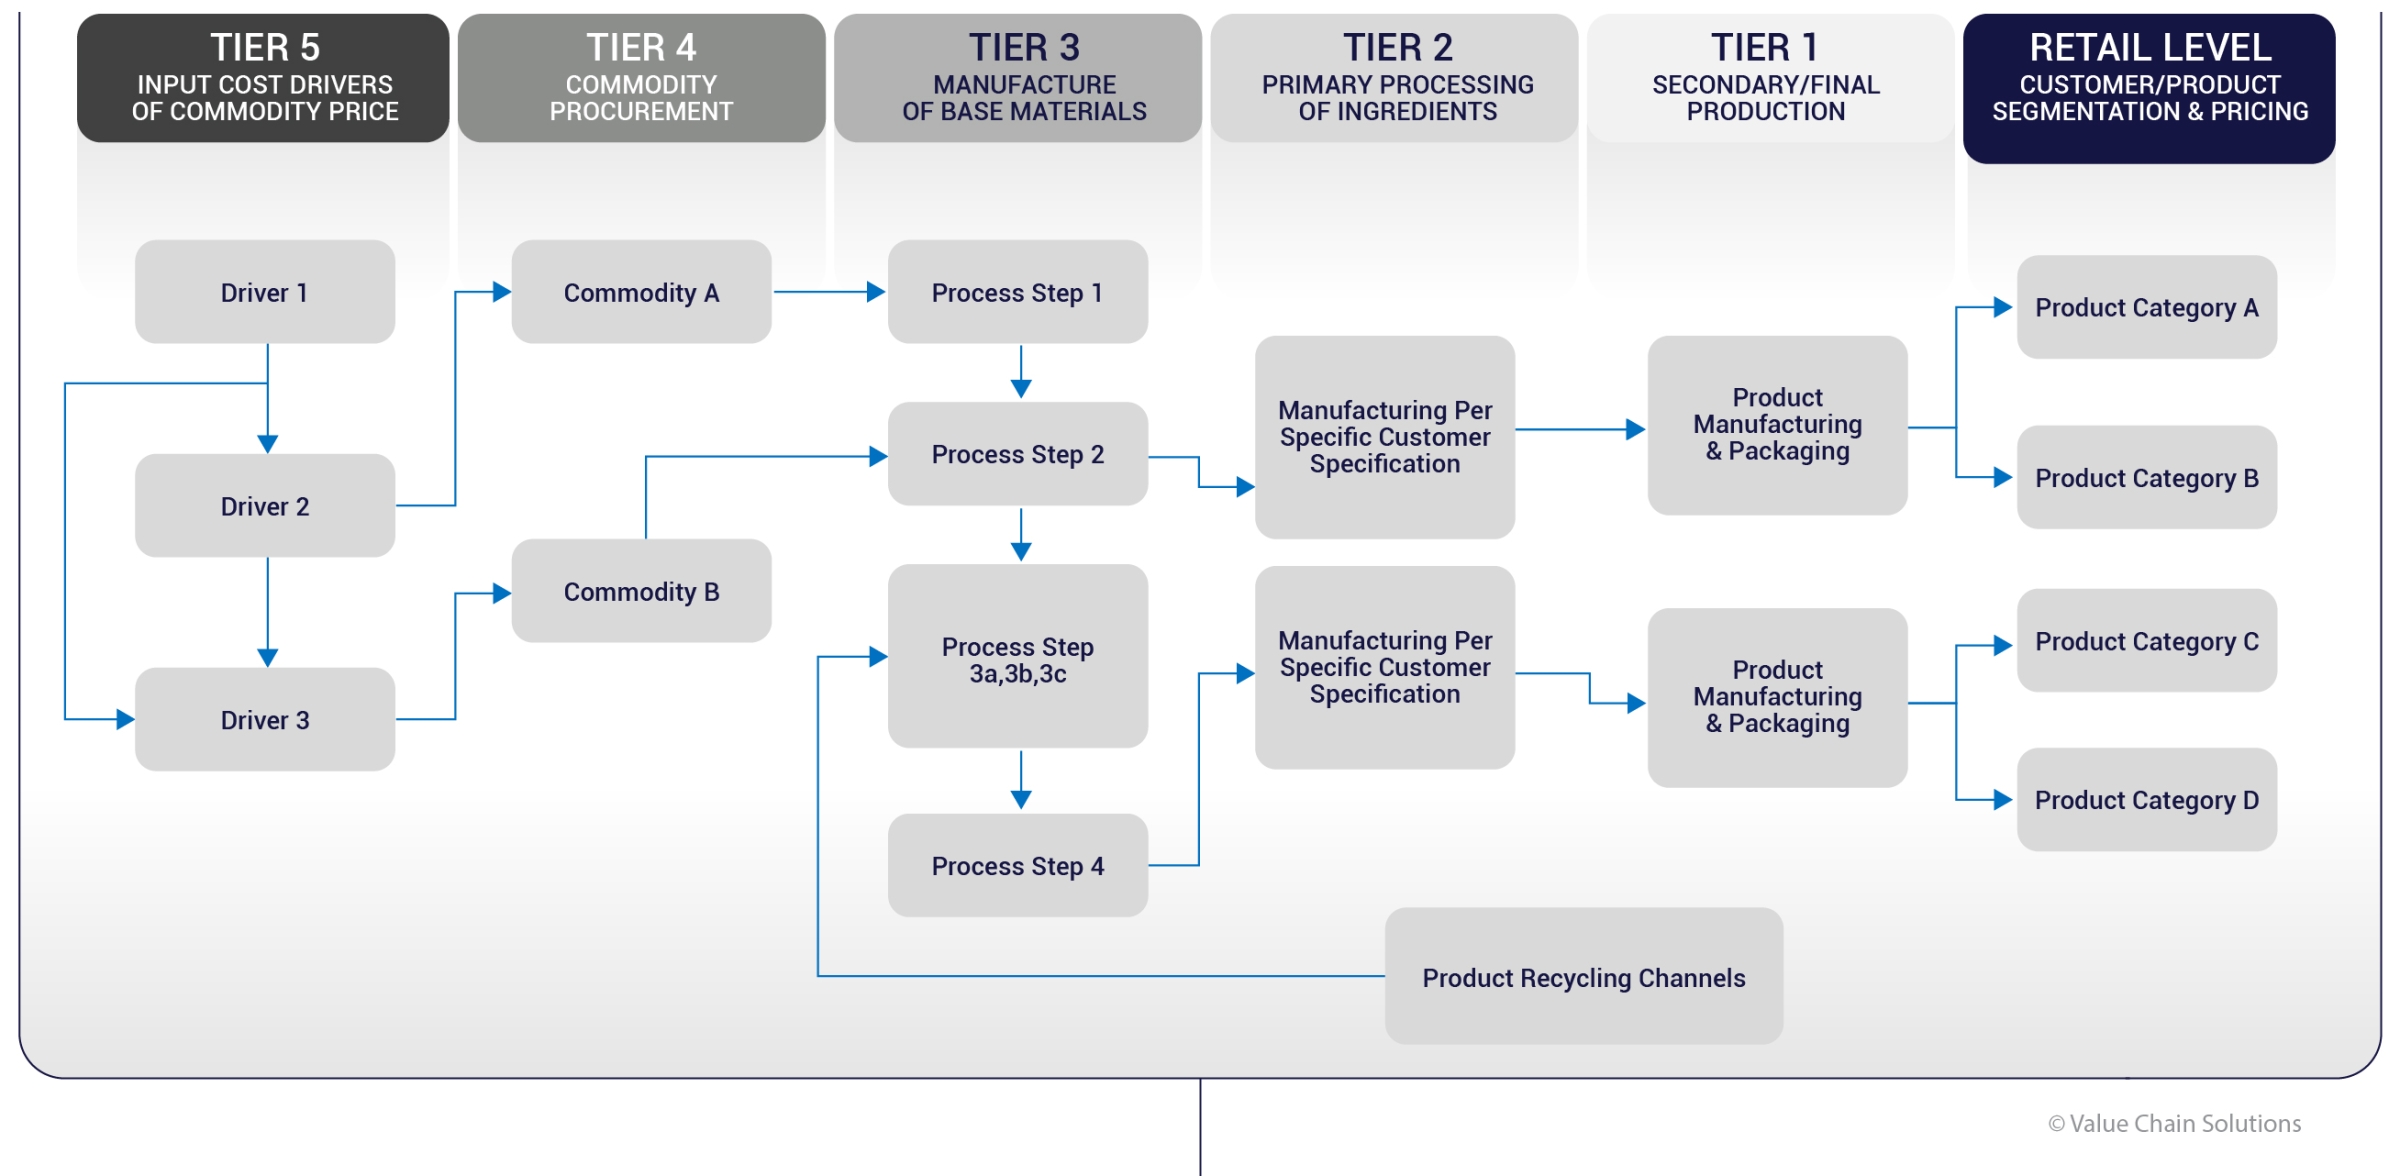
As illustrated in Figure 2, the first step in the process is to map the value chain and relationships to drive a common understanding of the relationships and dynamics at play.
In this example, the value chain will consist of 6 Tiers from Retail Customer to Commodity Cost Drivers:
In this example, the value chain will consist of 6 Tiers from Retail Customer to Commodity Cost Drivers:
THE RETAIL/CUSTOMER LEVEL’S FOCUS IS TO UNDERSTAND THE CURRENT AND TARGETED PRODUCT CATEGORIES IN SCOPE AS WELL AS THE TARGETED CUSTOMER BASE AND PRICE DYNAMICS.
Tier 1’s focus is on the final production of the packaged product and configuration and to ensure all parties understand dynamics such as the scope of the intended product changes as well as costing and volume assumptions.
Tier 2’s focus is on the value-adding processes which produce the subcomponents of the product at primary production level such as production of packaging material, substrates or preassembly of components.
Tier 3’s focus is on the processes which turn commodities into function-specific base materials for further manufacturing.
Tier 4’s focus is on the characteristics and drivers of basic commodity pricing and sourcing options.
Tier 5’s focus is on the cost and price drivers of commodities which normally form the basis of the value chain costs.
Mapping and understanding the suitable level of detail from customer to base inputs drives a common understanding of opportunities and risks between value chain partners as the first important step in order to collaborate on the positioning of existing and redesigned or new products.
In our next Insights piece, using this example, we will explore the process of identifying and prioritising opportunities and risks and later on the process of identifying insights and data required to enable joint action plans between value chain partners.
VALUE CHAIN SOLUTIONS IS A FULLY-INTEGRATED CONSUMER GOODS VALUE CHAIN ADVISORY AND SOLUTIONS BUSINESS, OPERATING ACROSS MULTIPLE ENTITIES AND GEOGRAPHIES. WE UNDERSTAND AND DEMYSTIFY COMPLEX VALUE CHAIN DYNAMICS FROM SHELF TO SOURCE AND PARTNER WITH OUR CLIENTS TO INTEGRATE FRAGMENTED DATA AND DRIVE VARIOUS INSIGHTS FROM IT TO FACILITATE STEPWISE IMPROVEMENT IN VALUE CHAIN MATURITY, ALONG WITH ONGOING OPTIMISATION AND COLLABORATION.
We use cookies on our website to give you the most relevant experience by remembering your preferences and repeat visits. By clicking “Accept All”, you consent to the use of ALL the cookies. However, you may visit "Cookie Settings" to provide a controlled consent. Click here to read our Privacy Policy.
This website uses cookies to improve your experience while you navigate through the website. Out of these, the cookies that are categorized as necessary are stored on your browser as they are essential for the working of basic functionalities of the website. We also use third-party cookies that help us analyze and understand how you use this website. These cookies will be stored in your browser only with your consent. You also have the option to opt-out of these cookies. But opting out of some of these cookies may affect your browsing experience.
Necessary cookies are absolutely essential for the website to function properly. These cookies ensure basic functionalities and security features of the website, anonymously.
Cookie
Duration
Description
cookielawinfo-checkbox-analytics
11 months
This cookie is set by GDPR Cookie Consent plugin. The cookie is used to store the user consent for the cookies in the category "Analytics".
cookielawinfo-checkbox-functional
11 months
The cookie is set by GDPR cookie consent to record the user consent for the cookies in the category "Functional".
cookielawinfo-checkbox-necessary
11 months
This cookie is set by GDPR Cookie Consent plugin. The cookies is used to store the user consent for the cookies in the category "Necessary".
cookielawinfo-checkbox-others
11 months
This cookie is set by GDPR Cookie Consent plugin. The cookie is used to store the user consent for the cookies in the category "Other.
cookielawinfo-checkbox-performance
11 months
This cookie is set by GDPR Cookie Consent plugin. The cookie is used to store the user consent for the cookies in the category "Performance".
viewed_cookie_policy
11 months
The cookie is set by the GDPR Cookie Consent plugin and is used to store whether or not user has consented to the use of cookies. It does not store any personal data.
Functional cookies help to perform certain functionalities like sharing the content of the website on social media platforms, collect feedbacks, and other third-party features.
Performance cookies are used to understand and analyze the key performance indexes of the website which helps in delivering a better user experience for the visitors.
Analytical cookies are used to understand how visitors interact with the website. These cookies help provide information on metrics the number of visitors, bounce rate, traffic source, etc.